It's a Small World

Most of the time that's a good thing

May 15, 2020

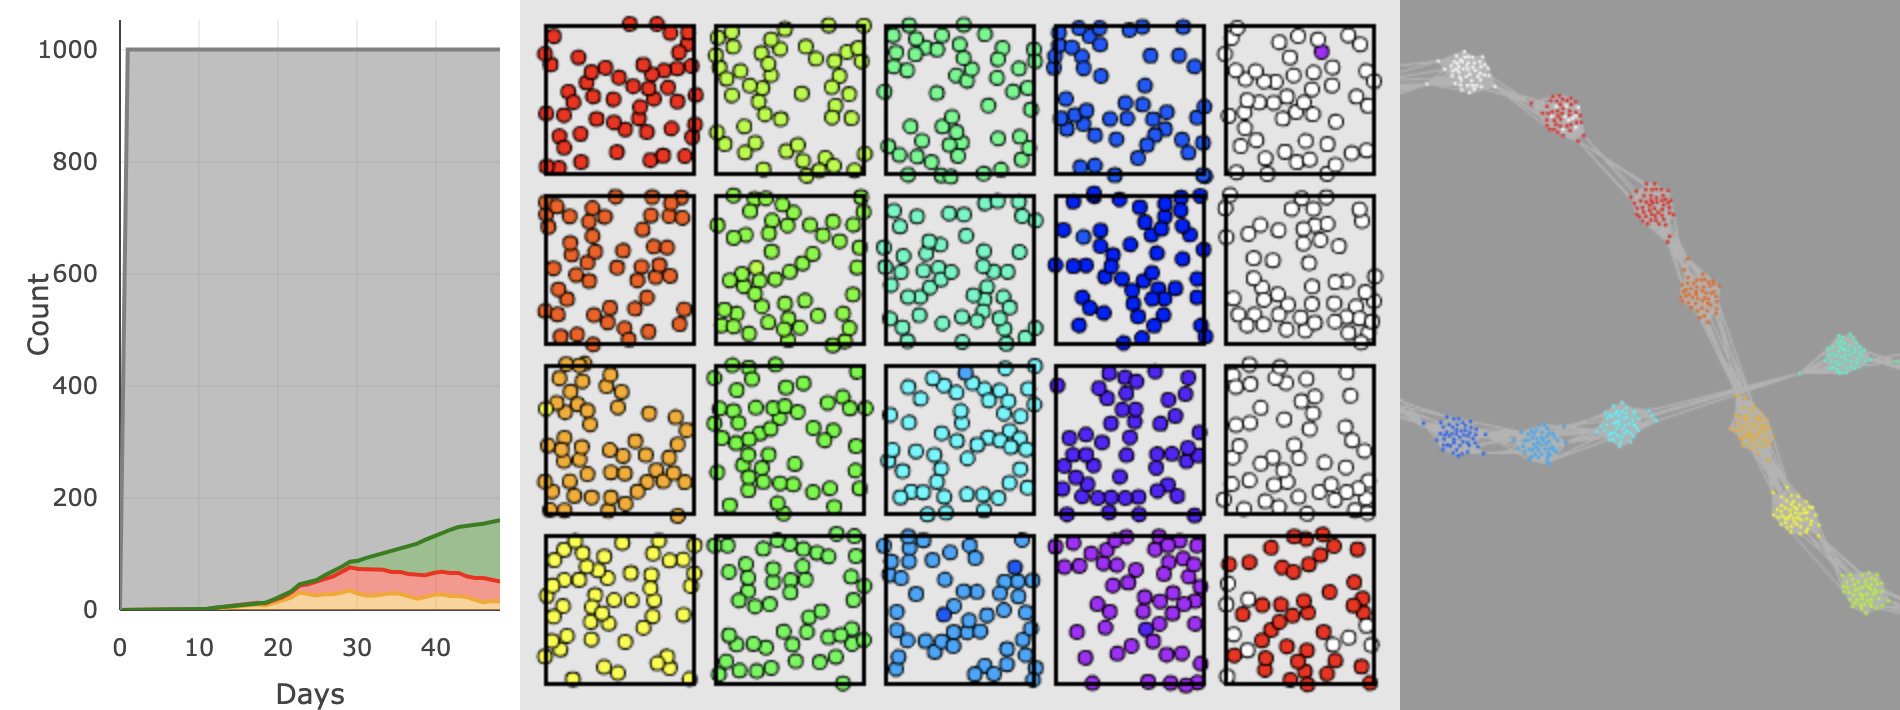
In the last walk through, we built up our web based pandemic simulator. We added multiple locations (Subpopulations) and experimented with how the spread of a pathogen was affected by having a few random visitors moving between them (Migration). This time we're going to extend the model a bit further. You will get to investigate how including more realistic kinds of movement between locations speeds up or slows down the spread of a disease.

First, we have to add even more subpopulations.

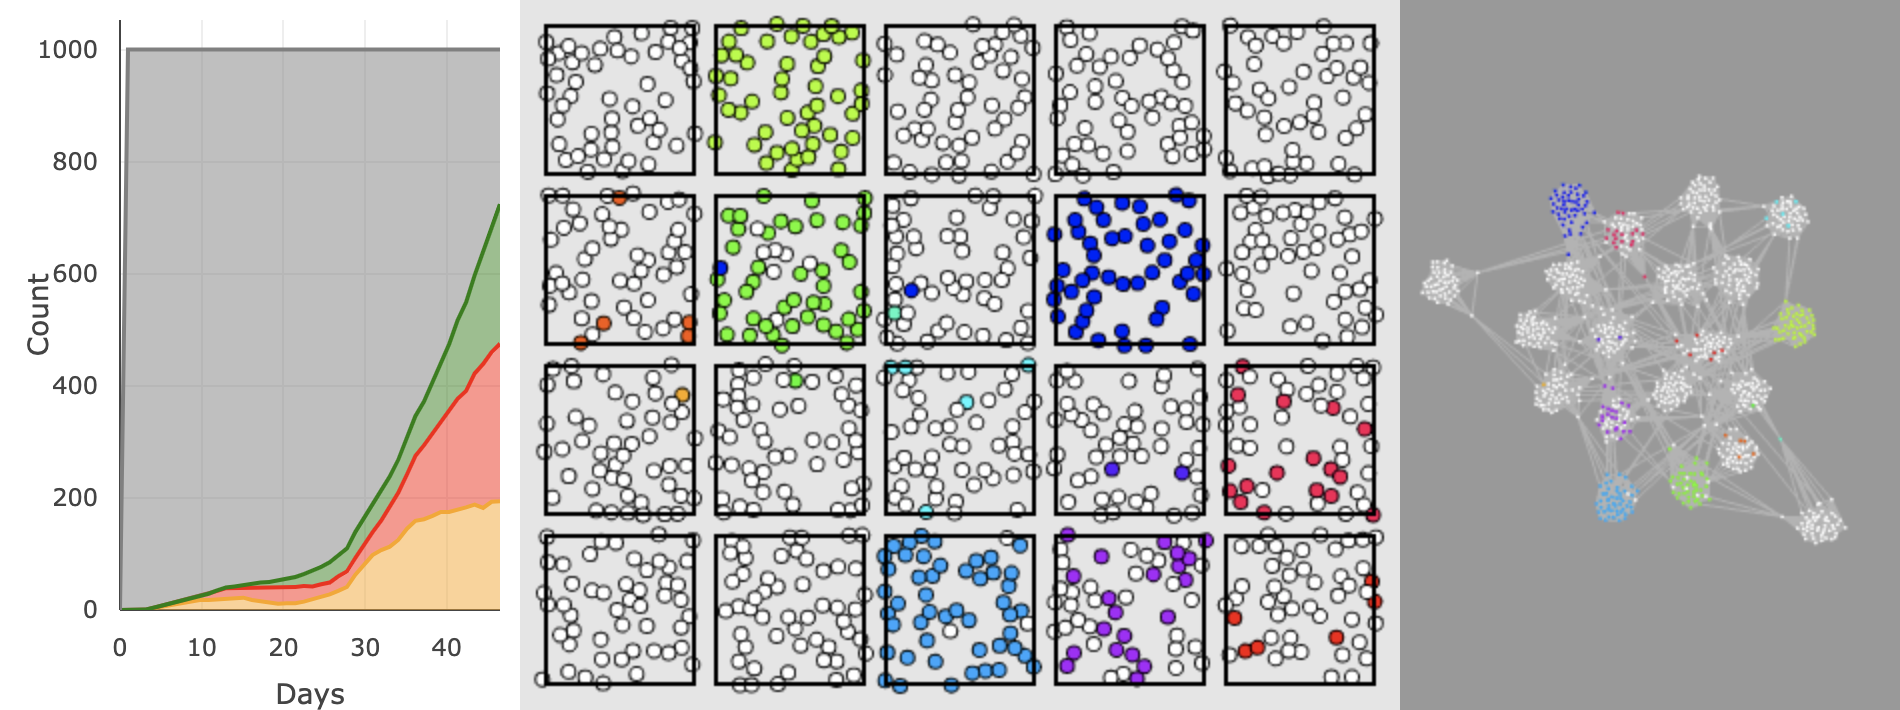
Right now, agents only move around in their own location. Let's start by adding some Local visitors.

disclaimer I am not an Epidemiologist or Public Health expert. This is not designed to be a predictive simulation of COVID-19. It is a simple model to understand and visualize basic disease dynamics.

Local Movement

Neighboring locations are more likely to share visitors

Let's turn on the contact graph so we can see how visitors moving locally between locations change the network of interactions.

Right now, there are no agents leaving their home location. Each subpopulation shows up as a tightly connected ball (or hairball) in the contact graph with no links to agents in neighboring locations. Without these connections holding locations together, most of the contact network has probably floated off your screen.

Let's increase the number of Local visitors to about 5 by adjusting the slider. Watch the contact network as it floats back into view.

Local Visitors Per Day:

0

Now that agents are leaving their home location, the contact network gets pulled back together.

If you pay close attention to the visitors' colors blipping in and out of the different locations, you'll notice that they're always from just one location away. If you dial up the number of local visitors even higher, you can start to see the Structure of the local migration network.

It's a Ring! In the grid of locations, the color spectrum hopefully helps you see which locations are neighbors. The locations in the ring are shown flattened from top-to-bottom, and then left-to-right in the subpopulation view. The whole thing loops from the the bottom right back to the top left (and vice versa).

Global Movement

We don't live in a ring world

We travel outside of our immediate neighborhoods and sometimes travel across the entire globe. We can simulate these kinds of long-range visits by moving an agent to a random location that isn't necessarily close.

I've reset the number of local visitors to 10, but now you can use the slider to adjust the number of Global visitors.

First try adding just one or two global visitors per day and watch what happens to the contact network.

Global Visitors Per Day:

0

These long-range travelers shrink the network in the browser. You can think of these global links as shortcuts through the local ring network. It doesn't take many of these long-range interactions to see this effect!

As you might imagine, this makes getting from one location to another take fewer steps. In a sense, we've made the separation between individuals in the world smaller.

This type of network, where there is a strong local component (like our ring) with some global interactions, is an example of a Small World Network. It turns out these networks pop up all over the place: neurons, genes, electrical grids, and our Facebook social networks. Most importantly for us, the patterns of air travel also have these small world properties!

Small World Pandemic

Let's watch a pandemic spread in a small world

Local Visitors Per Day:
10
Global Visitors Per Day:
0

I've reset the local visitors per day to 10, and the global visitors to 0. You can play with these sliders to setup the kind of structured world you want to watch a pandemic spread through.

Infected agents will show up white in the main population view and the contact graph. I removed the border colors in this version to declutter the visuals a bit, but there are still exposed, infected, and recovered agents like last time. The plot on the left will show these as the pandemic progresses. You can always mouse over the graph to see the labels and counts.

Once you're ready to start the pandemic, press the Infect Someone button to expose a random individual. You can press it multiple times to seed multiple infections if you like, but one is almost always enough.

You can start over by pressing the Restart Simulation to start as many virtual pandemics as you'd like!

A Few Things to Try

I'm going to temporarily disable the controls

If you want the controls back after playing with some of these scenarios, all you have to do is scroll up.

Let's imagine there are 10 total migrating agents per day, and we can split them up between local or global visitors. Looking at the pathogen spread if they were all local versus if they were all global would be an interesting first comparison!

Click the buttons below to run these scenarios automatically with a random agent exposed after 2 days.

It's shocking how much slower the pandemic spread is when there are only local visitors, isn't it?! Here's a few screenshots I grabbed while running it myself.

All Local Visitors

All Global Visitors

Now Let's Try With *Mostly* Local Visitors

Although clearly slower than the All Global scenario, the pandemic still spreads surprisingly fast with just one or two global visitors!

Where do we go from here?

Somewhere local, hopefully. Better yet, nowhere if you can help it. As you've seen first-hand, even a little bit of exposure between communities can dramatically speed up the spread of a pathogen. Right now, we need to make our world bigger, not smaller.

Hopefully you can see why these seemingly draconian lockdown orders have been used to limit the spread of COVID-19. They work!

But, I do understand that people can't stay home forever. We need to figure out the best ways to safely move forward. I'm afraid that too many people are equating the lockdown loosening with this pandemic becoming less serious.

That's a deadly mistake.