Developing an Intuition for Pandemics

May 4, 2020

When you hear an emergency traffic report, you have an idea of how that news is going to affect your plans (when we still had plans, anyway). We have an intuition for the way traffic works and fits in with our daily routines, but we didn't get that intuition from just listening to traffic reports. Actually sitting in our car bumper-to-bumper taught us to plan ahead for road closures and generally when to avoid the highway.

We don't have that intuition for pandemics yet, but we do have a lot of pandemic reports.

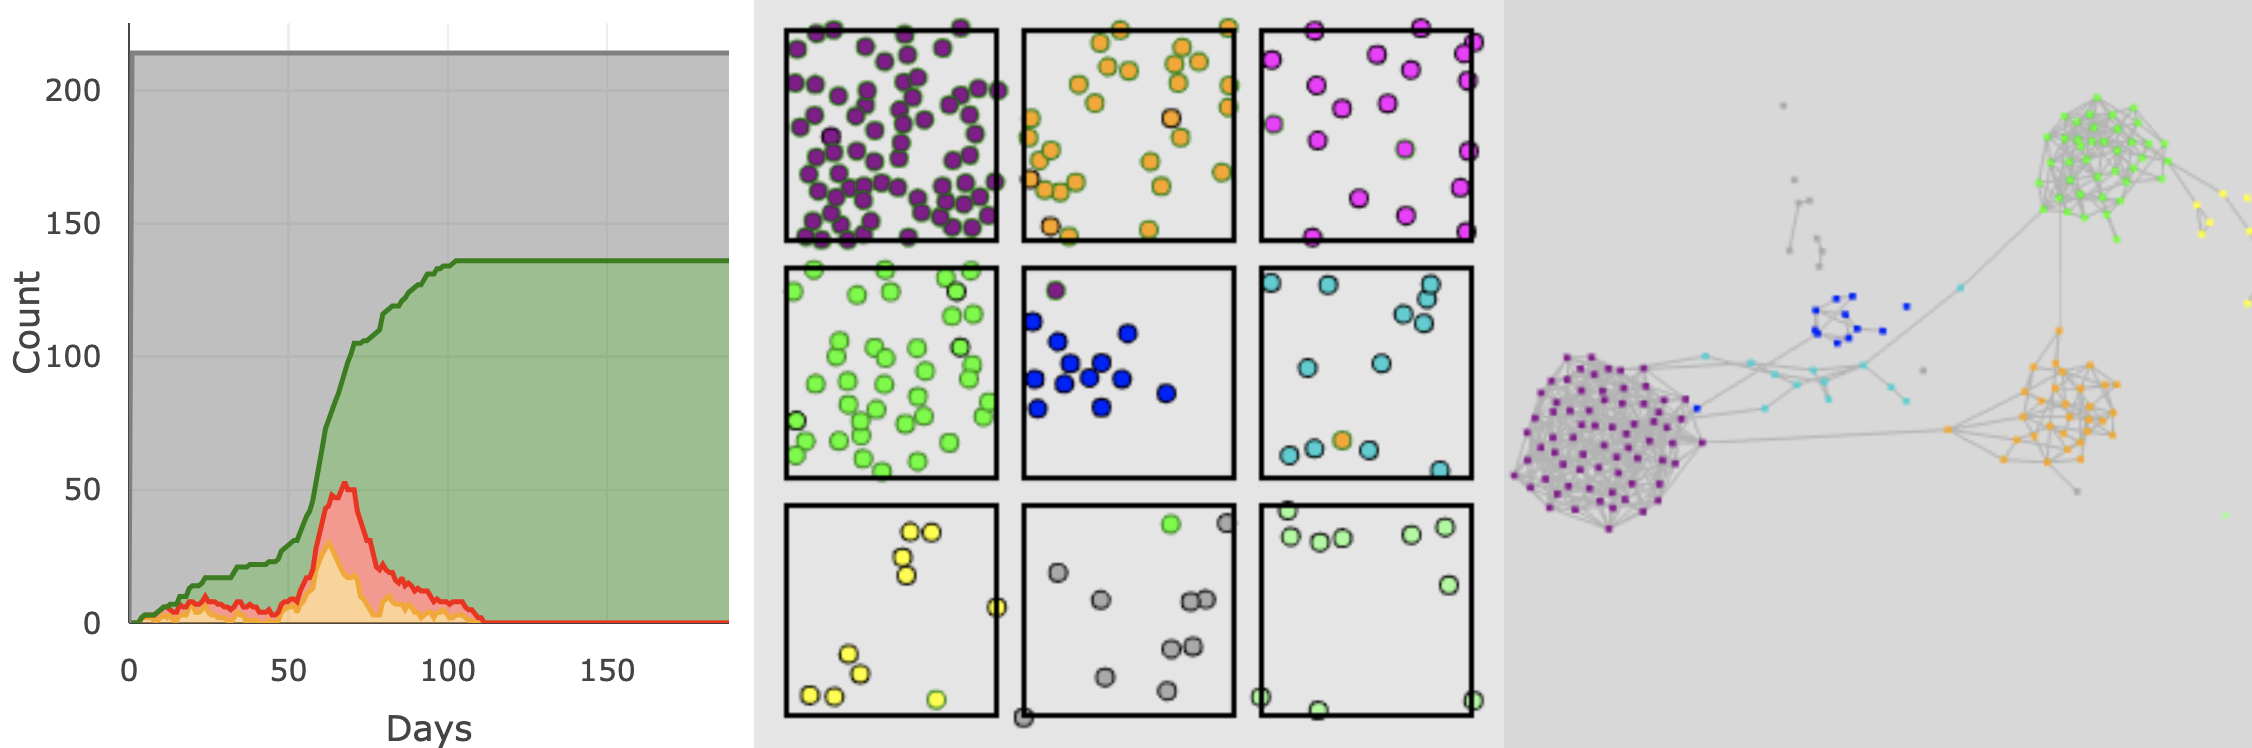
What if you could watch virtual epidemics unfold directly in your web browser to build that intuition rather than waiting around and learning by making mistakes and dealing with their fallout? Imagine if new pandemic plans and policies came with an interactive simulation that demonstrated (at least virtually) their intended consequences.

disclaimer I am not an Epidemiologist or Public Health expert. This is not designed to be a predictive simulation of COVID-19. It is a simple model to understand and visualize basic disease dynamics.


Why I Made This

I'm an Assistant Professor at the University of Michigan in the Ecology and Evolutionary Biology department, and the Center for the Study of Complex Systems. I study how coevolution between hosts and their pathogens drive really fascinating ecological and evolutionary dynamics. In the Fall, I'll be teaching a new course on the Ecology and Evolution of Infectious Disease.

I've always believed that hands-on learning is the best way to build intuition about complex topics, and that's something I'm planning to bring to my course in the fall. I'm also a big fan of simulations. That's true for the classes I teach, as well as in my own research.

There are a lot of great resources for scientists interested in studying disease dynamics, and several good simulation frameworks that are geared towards teaching broadly about disease transmission. I spent some time looking for something that would run in web browsers, so that students could get right into experimenting without having the universally loathed class period dedicated to installing software. Unfortunately, I didn't find a simulation with the right mix of simplicity (to get rid of so many of the complicated bits) and flexibility (to add in the bits that might be important) for this course.

So, I built it. Keep scrolling to learn more about it.


Simple Agents in a Simple World

Each circle is an "Agent"

An agent is just another word for an Individual in the simulation. In this world, agents are drawn as circles and move around in their world randomly. If they wander too far in one direction, they loop back around on the other end of the world.

Sometimes the agents bump into each other. It might help to imagine that represents seeing someone in an elevator, visiting a friend, or actually physically bumping into someone. In any case, we'll call these events Contacts.

Infection

We can expose a few organisms in this population

First you'll see agents with a small orange border. Those are Exposed individuals, after some time they'll become Infected and turn red. The Infected agents are contagious, and if they bump into Susceptible (black border) agents, there is a chance they'll transmit the disease. Eventually, Infected organisms will recover and develop resistance to the disease. You'll see these Recovered agents with a green border in the simulation. We would call this, then, an Agent Based version of a traditional Susceptible, Exposed, Infectious, Recovered (SEIR) model.

Now, it's a little hard to see all the different colored borders on the agents, so lets start plotting what's going on in the population.

Scroll on to see the plot!

Plotting

Because those little borders are hard to count

Now that we have a plot, we also can see the timescale of the simulation. We could make the agents move faster or slower, depending on how much "physical distancing" we're trying to model. We could also increase or decrease the population size to simulate differences in location density. You'll get to play with these parameters in the full simulation later!

Multiple Locations

We don't all live in one little box!

We, like most other organisms on earth, don't live in one big population. Instead we are spread across space in different cities or towns, and live in different neighborhoods or complexes. We model these sorts of things as a Metapopulation, where several subpopulations are connected through Migration of individuals. Migration in this abstract sense could represent visiting your friend in a neighboring city, for example.

The outcome of this simulation is Stochastic, which means every time you run it you might see something different. Maybe the disease spread slowly through each subpopulation, and you saw a prolonged (but flat) infected curve. Or maybe you saw multiple infection peaks as the disease spread quickly in multiple subpopulations at different times. When we are modeling disease dynamics, it's important to get a sense of the range of possible outcomes and how likely they are.

Contact Graph

(The 7 Degrees of Disease Transmission)

One of the really neat features of agent based models is that we can keep track of information about each individual in the simulation. This lets us track, for example, who interacted with each other over some period of time. As you might imagine for disease transmission, this could be an incredibly useful bit of information.

We can represent these contacts with a Graph. Every node (colored square) in the rightmost visualization depicts one of the agents in the metapopulation. An edge (the line drawn between two nodes) represents a contact that happened within the last 7 days of the simulation.

You'll notice the agents form the same subpopulation tend to be more connected to each other than agents from other locations. You might hear these structures in graphs called Modules or Communities.

City and Countryside

Dense cities and more isolated rural areas are connected, and change the dynamics of disease spread

As an example, lets make a metapopulation simulation of a metropolitan area. In a typical metropolitan area, there is a densely populated city surrounded by lower density towns and rural areas. Here, the dense city is in the top left (purple) and the density decreases as we move down and to the right.

You can easily see the effect of density on the contact graph, where the large city is a tight-knit network, and the lower density locations have more tendrils.

Thanks to some fantastic work by network scientists and epidemiologists, we know that disease dynamics in metapopulations are more likely to have multiple waves (or peaks) of infection, and more variation in how long it takes to resolve an epidemic. A recent (not yet peer-reviewed) pre-print also highlights the role of density in metapopulations on the intensity of COVID-19. Counterintuitively, lower density locations had more intense outbreaks, with most of the infections happening in a relatively short period of time. This observation is critical for our next steps in pandemic policy making.

Keep scrolling for an interactive exercise!

Protecting Our Small Towns

Smaller and rural towns are preparing for a battle, but they do not have the same pool of resources that large cities have been mobilizing. People may not have easy access to hospitals, and many of the satellite hospital systems that typically service these locations don't have the required ICUs or equipment to treat COVID-19 patients. There are several good articles about these and concerns and more here, here, and here.

To get an intuition about how limiting movement between the cities and rural areas affects disease dynamics, try experimenting with the slider and see what happens when there is a lot of movement.

Visitors Per Day:

3

If you cranked up the number of visitors, you probably saw an effect on the contact network and watched only a single peak of infections that hit the high and low density locations at similar times.

Now, try keeping movement limited to just a few visitors. You'll probably see a more spread out peak, and maybe even multiple peaks as the epidemic is no longer synchronized between locations.

Try running the simulation a few times to get a sense of the possible outcomes!

How Do We Help?

Remember that larger cities have most of the equipment and ICUs required to treat COVID-19. When the peaks are spread out or shifted in time, those hospitals can treat more patients coming from rural areas. If the small towns and big cities are synchronized, the hospital system will be far beyond capacity from the start.

While we're waiting for therapies for COVID-19, the best we can do is take physical distancing and stay-home orders seriously. Even when it seems like things are improving, or when our community hasn't had an outbreak yet, we are still protecting the spread beyond current hotspots into more vulnerable communities.

There are even more configuration options in the full simulator!

Shout Outs

I want to thank my friends and colleagues that helped, you all were instrumental. Particular shout out to Abbie Jacobs, Scott E. Page, Samuel Scarpino, C. Brandon Ogbunu and Shane DuBay.